반응형

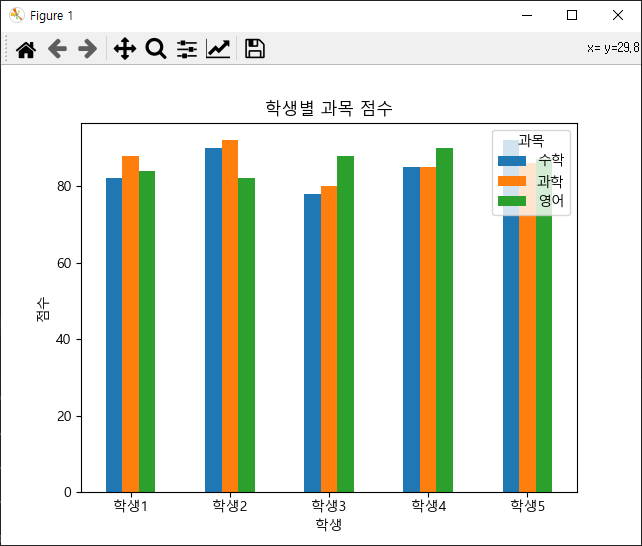
[Python & Matplotlib] 학생들 성적 시각화 예시
수학,과학,영어 의 과목들을 학생별로 시각화한 예시입니다.
예시코드
import pandas as pd
import matplotlib.pyplot as plt
import matplotlib

# matplotlib 한글 폰트 설정
matplotlib.rcParams['font.family'] = 'Malgun Gothic'  # 'Malgun Gothic' 대신 사용할 수 있는 폰트로 변경 가능
matplotlib.rcParams['axes.unicode_minus'] = False  # 음수 부호 표시 문제 해결

# 데이터 생성
data = {
    '학생': ['학생1', '학생2', '학생3', '학생4', '학생5'],
    '수학': [82, 90, 78, 85, 92],
    '과학': [88, 92, 80, 85, 86],
    '영어': [84, 82, 88, 90, 87]
}

# pandas DataFrame으로 데이터를 구성
df = pd.DataFrame(data)

# 데이터 표로 출력
print(df)

# 데이터를 차트로 시각화
fig, ax = plt.subplots()
df.set_index('학생').plot(kind='bar', ax=ax)
ax.set_title('학생별 과목 점수')
ax.set_xlabel('학생')
ax.set_ylabel('점수')
plt.xticks(rotation=0)
plt.legend(title='과목')
plt.show()
결과값
728x90
반응형
'Coding > Python' 카테고리의 다른 글
| [Python & SQLAlchemy] orm에서 order_by를 사용하여 최근날짜 순으로 정렬하는 방법 !! (0) | 2024.05.09 |
|---|---|
| [Python & SQLAlchemy] orm으로 update문 사용하는 방법 !! (0) | 2024.05.07 |
| [Python & Django] No module named 'mathfilters' when adding to INSTALLED_APPS 에러 해결 방법 !! (0) | 2024.04.17 |
| [python & ChatGPT] 챗지피티 API 호출 시 사용하는 파라미터(Parameter)들의 기능 (0) | 2024.04.13 |
| [Python] 셀레니움(selenium) ChromeDriver PermissionError 해결방법 !! (0) | 2024.04.09 |


댓글